บันทึกการทำ Performance Testing ด้วย Gatling
การทดสอบ Performance testing ถือเป็นสิ่งสำคัญเนื่องจาก
- ทำให้เราเห็นว่าระบบงานมี performance ที่ดีตามที่ตกลงกันไว้ เช่น ระบบต้องส่งผลลัพธ์จากการค้นหาข้อมูลภายใน 3 วินาที หรือ สามารถสร้าง ticket 1000 ใบ ภายใน 1 วินาที
- ทำให้เราสามารถเทียบ performance ของระบบต่างๆ ได้
- ทำให้เราหาจุดที่ทำให้ระบบงานช้าหรือเป็นคอขวด (bottleneck) ได้่ง่ายขึ้น เพื่อทำการปรับปรุงระบบให้ทำงานเร็วขึ้นต่อไป
ดังนั้นก่อนเริ่มทดสอบ เราควรจะต้องรู้และทำความเข้าใจระบบของเราก่อน เช่น
- Environment ระบบงานของเรารันอยู่บนอะไร ต้องเข้าผ่าน VPN ไหม มีจำนวนเครื่องเท่าไร
- Scenario พฤติกรรมของ User เป็นอย่างไร เช่น login เข้าหน้าเลือกสินค้า สั่งซื้อ จ่ายเงิน logout
- Throughput หรือจำนวน transaction ต้อ 1 หน่วยเวลา (หน่วยที่นิยมคือ Transactions per second หรือ TPS) เช่น มี 10 งาน แต่ระบบรับได้แค่ 5 งาน/วินาที แสดงว่าอีก 5 งานต้องเข้าคิวรอให้เสร็จก่อน
- Workload สัดส่วนจำนวนของงานที่ User ทำการ interact กับระบบ เช่น frontend 40% backend 30% batch process 10% เป็นต้น
จากนั้นทำการออกแบบ performance requirement ให้ชัดเจน เพื่อที่จะทำการเขียน test script ต่อไป
สำหรับ tool ที่เราจะใช้คือ Gatling เนื่องจาก
- มี Domain Specific Language (DSL) ที่เข้าใจง่าย
- สามารถทำ scenario ที่ซับซ้อนขึ้นมาได้
- การทำ reporting เพื่อแสดงผลลัพธ์ของการทดสอบโดยอัตโนมัติ
- สามารถ integrate เข้ากับระบบ Continuous Integration (CI)
โดยการใช้งาน Gatling มีแนวคิดคร่าวๆ ดังนี้
- Virtual User แต่ละ user ที่สร้างขึ้นสามารถมี action และ data ที่แตกต่างกันได้ เช่น Regular user และ Admin user
- Scenario กำหนด scenario จากพฤติกรรมของ User ผ่าน script
- Simulation กำหนดว่าจะให้รัน scenario ไหน และจะให้ virtual user เข้ามายังไง หลักๆ จะมี 2 แบบ
- Session จัดการ state ของ virtual user
- Feeders นำ data ที่ต้องการจะทดสอบ inject เข้าไปใน session
- Checks การ capture ผลลัพธ์จาก server เช่น check ว่าระบบต้องไม่ส่ง HTTP 5xx กลับมา
- Assertions การนำผลลัพธ์มาวิเคราะห์เพื่อดูว่า performance ผ่านตาม criteria ที่ตกลงกันไว้ไหม
- Reports การแสดงผลลัพธ์ผ่าน report ที่เป็น HTML file
ในตัวอย่าง เราจะทำการทดสอบระบบ RESTful API มาลองดูกัน
ขั้นตอนที่ 0 ติดตั้งระบบให้พร้อม
- JDK 8 หรือ 11 ขึ้นไป 64bit
- Scala version 2.12.x (ใน doc บอกว่าไม่ support 2.11.x และ 2.13.x)
ขั้นตอนที่ 1 ติดตั้ง Dependencies กันก่อน
ทำการสร้าง project ที่มี structure ดังนี้
src
│   build.gradle
└───gatling
│   │
│   └───scala // สำหรับเก็บ test script และ configuration
│   |
|   └───resources // สำหรับเก็บ test data และ feed
│
│
จากนั้นใน build.gradle ติดตั้ง Gradle plugin ของ Gatling ดังนี้
ขั้นตอนที่ 2 Setup configuration สำหรับการทดสอบใน HTTP protocol
คำอธิบาย ทำการ configure service hostname ผ่าน System property service.url โดยตั้งค่า default ไว้เป็น http://localhost:8080 จากนั้นสร้าง protocol ที่จะใช้ใน script จริงให้เป็น HTTP ผ่าน base url
ข้อควรระวัง import io.gatling.core.Predef._ และ io.gatling.http.Predef._ สำหรับการเขียน DSL และ ปิดการ Optimize import ใน IDE ด้วยนะครับ ไม่งั้น code จะ compile ไม่ได้
ขั้นตอนที่ 3 สร้าง Simulation
ตัวอย่างเช่น เราจะทำการทดสอบระบบการค้นหา order ผ่าน ID /orders/${orderId} แบบเรียงลำดับเป็นเวลา 100 วินาที สิ่งที่เราต้องเตรียมก่อนคือ
-
Feed ให้ไปเอา order ID ตามที่ระบุไว้ใน CSV file ละกัน
- Throughput เอาง่ายๆ ก่อน 1 TPS 100 วินาที
- Assertions ก็อย่างน้อย 99% ต้อง success ค่าเฉลี่ยอยู่ที่ 500ms สูงสุดไม่เกิน 1000ms
ก็จะได้ script คร่าวๆ เป็นแบบนี้
สามารถแก้ Throughput ได้ผ่าน System property ชื่อว่า requests.per.seconds และ requests.duration ได้เลย
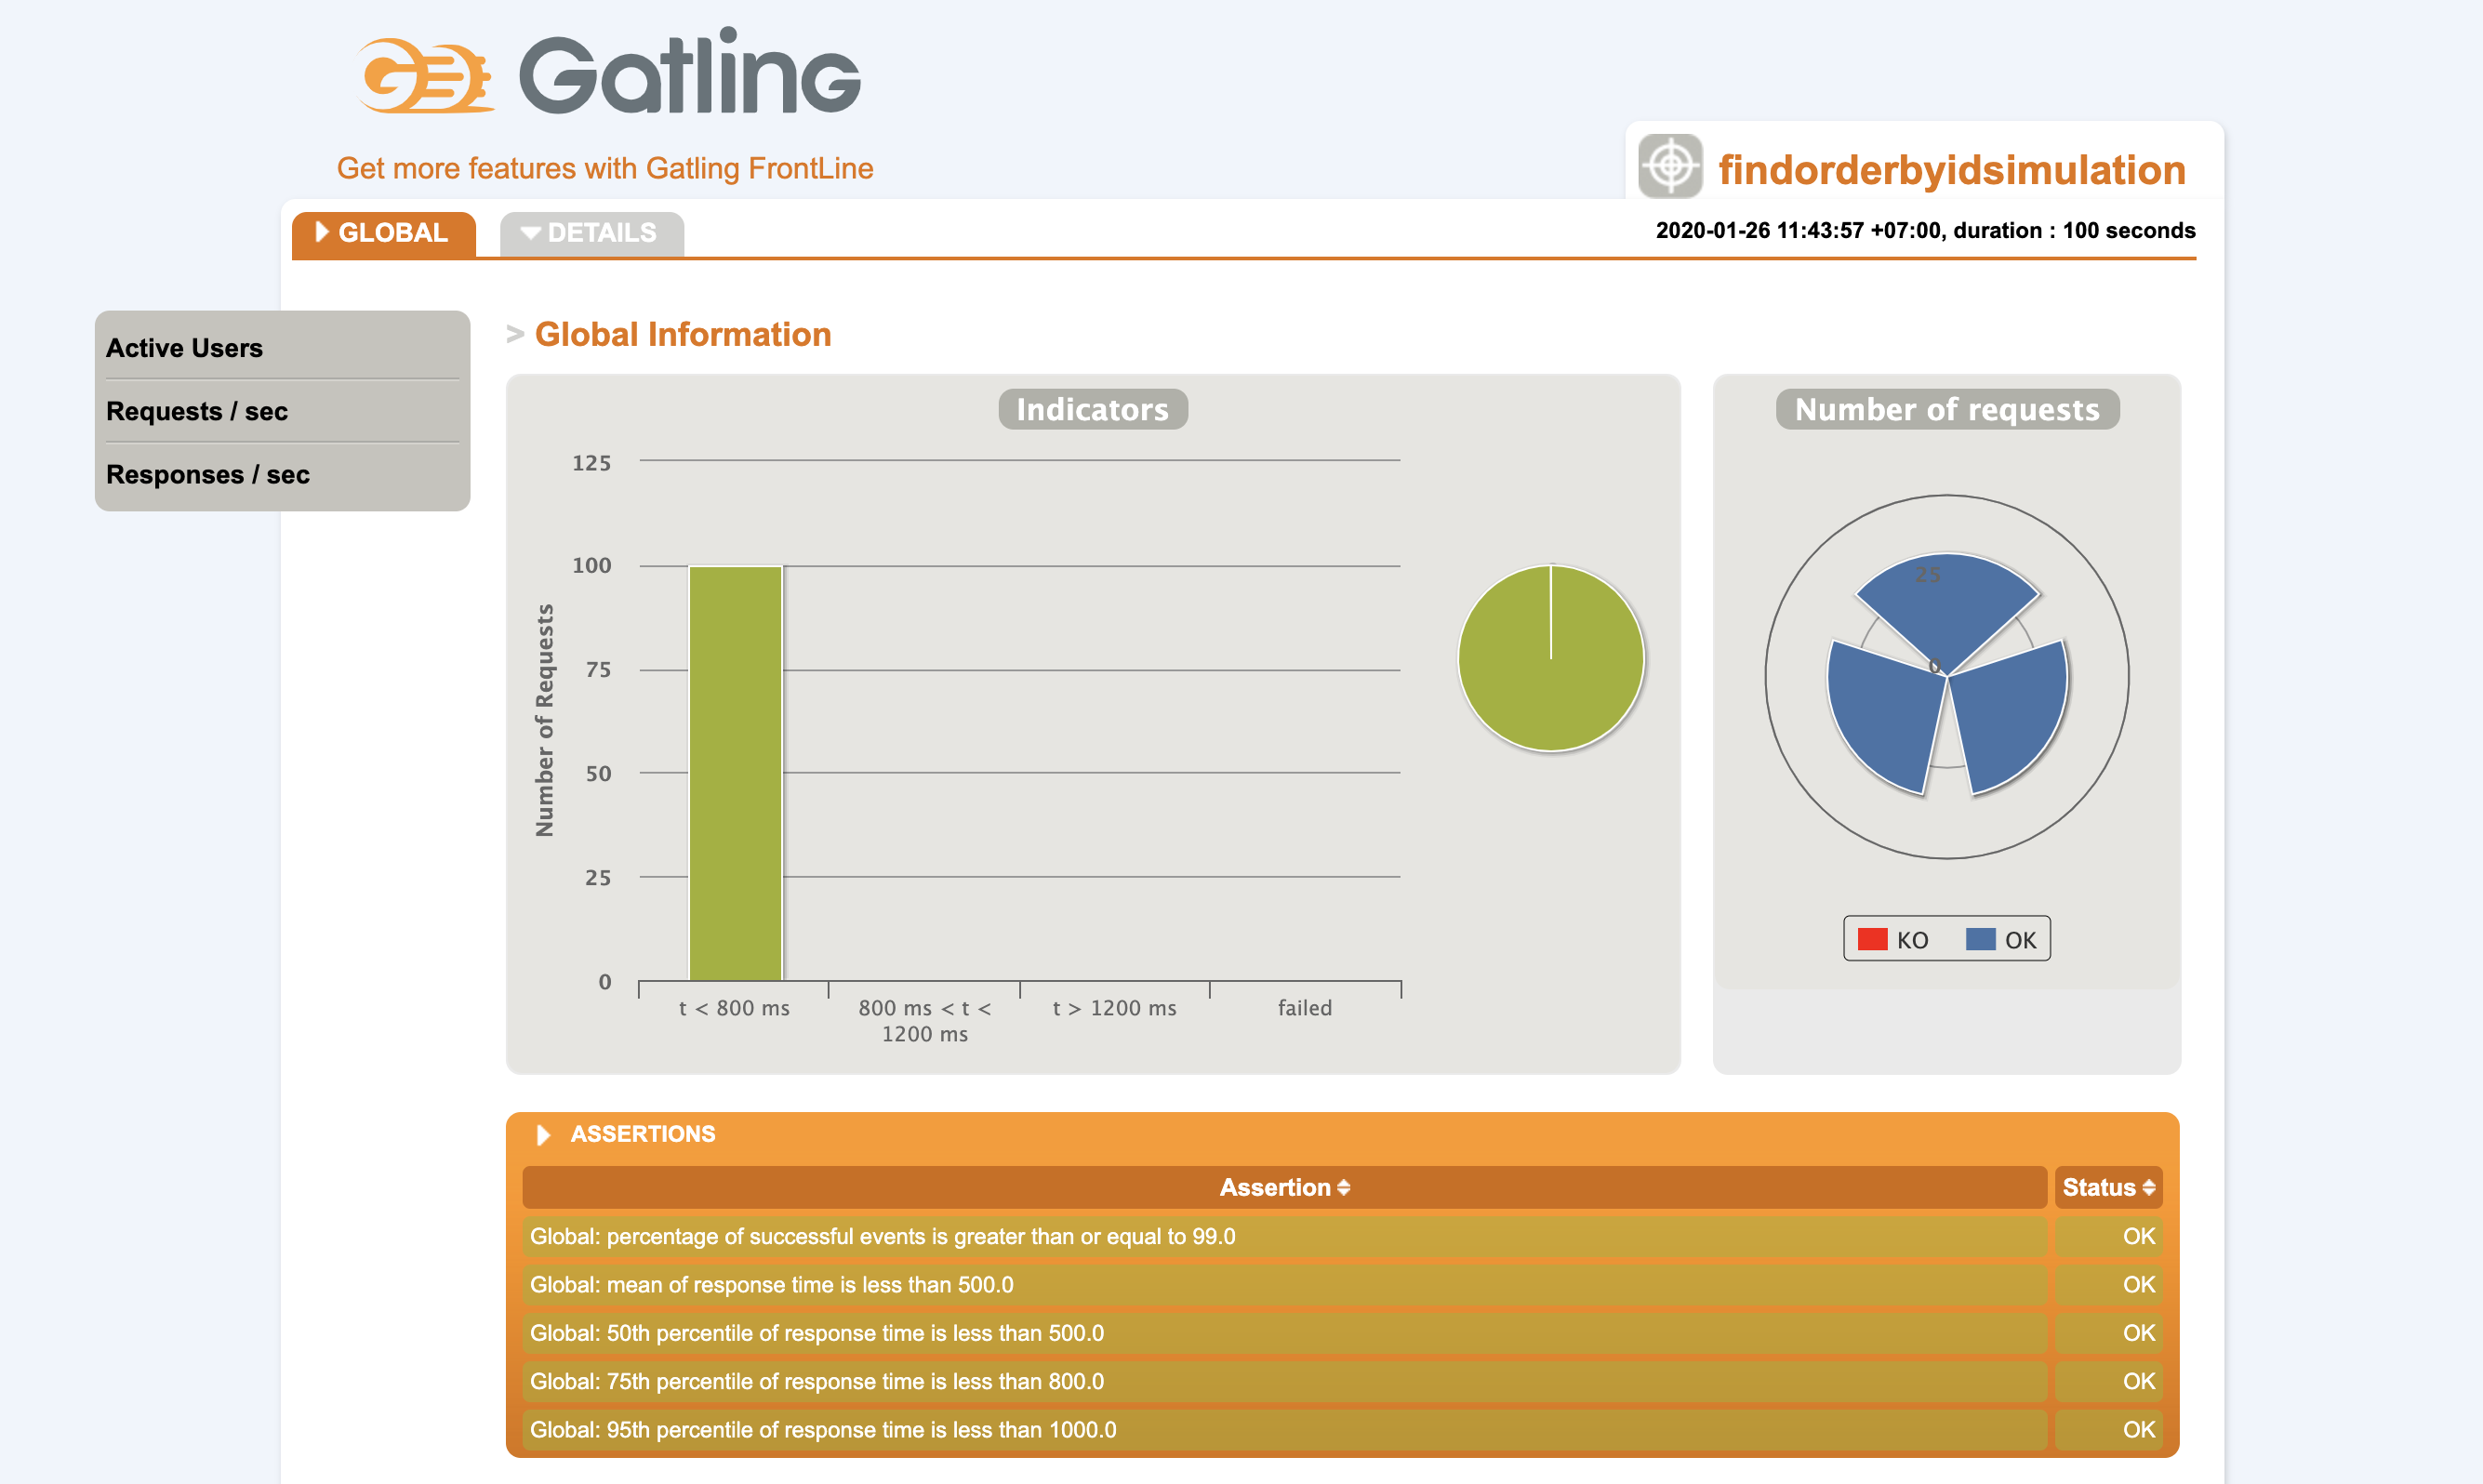
ขั้นตอนสุดท้าย รัน Simulation และดูผลลัพธ์จาก report
เราสามารถรันคำสั่งได้ผ่าน command line ./gradlew gatlingRun -Dservice.url=example-service.com -Drequests.per.second=1 -Drequests.duration=100
ระบบจะทำการ Simulate ตามที่เรากำหนดไว้
Simulation com.raksit.example.order.FindOrderByIdSimulation started...

================================================================================
2020-01-26 10:38:54                                           5s elapsed
---- Requests ------------------------------------------------------------------
> Global                                                   (OK=5      KO=0     )
> find order 10                                            (OK=2      KO=0     )
> find order 11                                            (OK=2      KO=0     )
> find order 12                                            (OK=1      KO=0     )

---- Find Order by ID ----------------------------------------------------------
[###                                                                       ]  5%
          waiting: 95     / active: 0      / done: 5
================================================================================


================================================================================
2020-01-26 10:38:59                                          10s elapsed
---- Requests ------------------------------------------------------------------
> Global                                                   (OK=10     KO=0     )
> find order 10                                            (OK=4      KO=0     )
> find order 11                                            (OK=3      KO=0     )
> find order 12                                            (OK=3      KO=0     )

---- Find Order by ID ----------------------------------------------------------
[#######                                                                   ] 10%
          waiting: 90     / active: 0      / done: 10
================================================================================
.
.
.
Simulation com.raksit.example.order.FindOrderByIdSimulation completed in 99 seconds
Parsing log file(s)...
Parsing log file(s) done
Generating reports...

================================================================================
---- Global Information --------------------------------------------------------
> request count                                        100 (OK=100    KO=0     )
> min response time                                      8 (OK=8      KO=-     )
> max response time                                     30 (OK=30     KO=-     )
> mean response time                                    10 (OK=10     KO=-     )
> std deviation                                          3 (OK=3      KO=-     )
> response time 50th percentile                         10 (OK=10     KO=-     )
> response time 75th percentile                         10 (OK=10     KO=-     )
> response time 95th percentile                         12 (OK=12     KO=-     )
> response time 99th percentile                         27 (OK=27     KO=-     )
> mean requests/sec                                      1 (OK=1      KO=-     )
---- Response Time Distribution ------------------------------------------------
> t < 800 ms                                           100 (100%)
> 800 ms < t < 1200 ms                                   0 (  0%)
> t > 1200 ms                                            0 (  0%)
> failed                                                 0 (  0%)
================================================================================

Reports generated in 0s.
Please open the following file: <your-path>/build/reports/gatling/findorderbyidsimulation-20200126044357162/index.html
Global: percentage of successful events is greater than or equal to 99.0 : true
Global: mean of response time is less than 500.0 : true
Global: 50th percentile of response time is less than 500.0 : true
Global: 75th percentile of response time is less than 800.0 : true
Global: 95th percentile of response time is less than 1000.0 : true
สามารถเข้าไปดู report ได้ตาม path ที่ขึ้นได้เลย

สำคัญที่สุดคือ
เราต้องนำข้อมูลที่ได้มาวิเคราะห์ด้วย Monitoring tools หรือ Analytics tools เพื่อแก้ไขและปรับปรุง ทั้งในด้าน Application ทั้ง Network และทั้ง Infrastructure จากนั้นปรับ Tune ทีละค่า และทดสอบต่อไป
References
Example source code